- Client
- Shorebreak Energy Developers
- Role
- Platform architecture, data pipeline and dashboards
- Stack
- Google Cloud App Engine, Cloud Tasks, Cloud SQL, WordPress, Highcharts
- Sources
- More than 100 eGauge devices
The brief
Shorebreak Energy Developers builds commercial solar in California and keeps watching those systems for their owners after install. It needed one platform for both jobs: owners checking what their system produced and saved, and an operations team watching the whole portfolio.
Data pipeline on Google Cloud
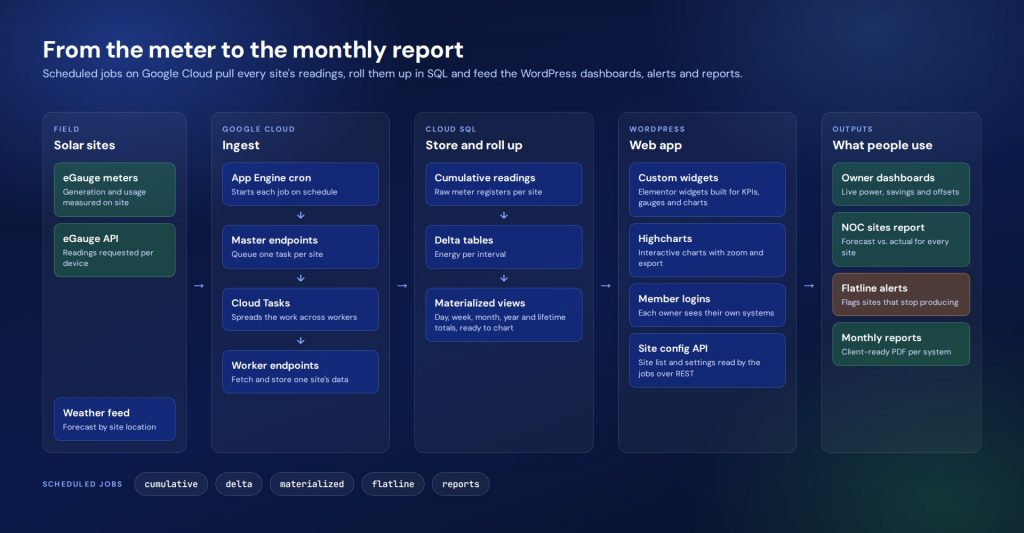
App Engine cron starts each job on a schedule. A master endpoint queues one Cloud Task per site, and a worker fetches that site’s readings from the eGauge API and writes them to Cloud SQL. Running each site as its own task means one slow or offline meter does not hold up the rest.
Raw cumulative readings are converted to interval deltas and summarized into materialized views for day, week, month, year and lifetime, so dashboards read pre-computed totals instead of scanning years of raw data. Site settings live in WordPress, and the jobs read them over the REST API.
The site dashboard
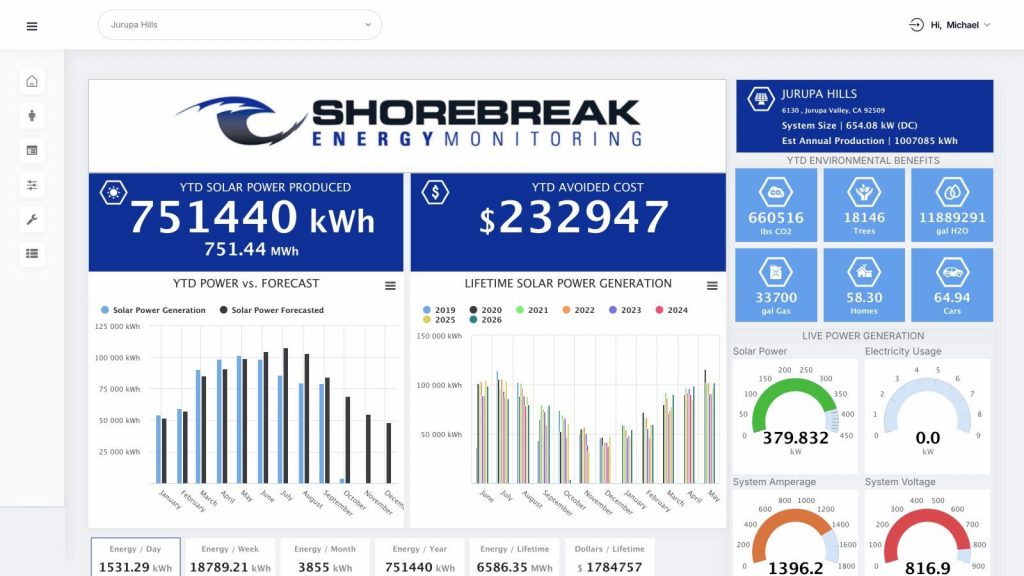
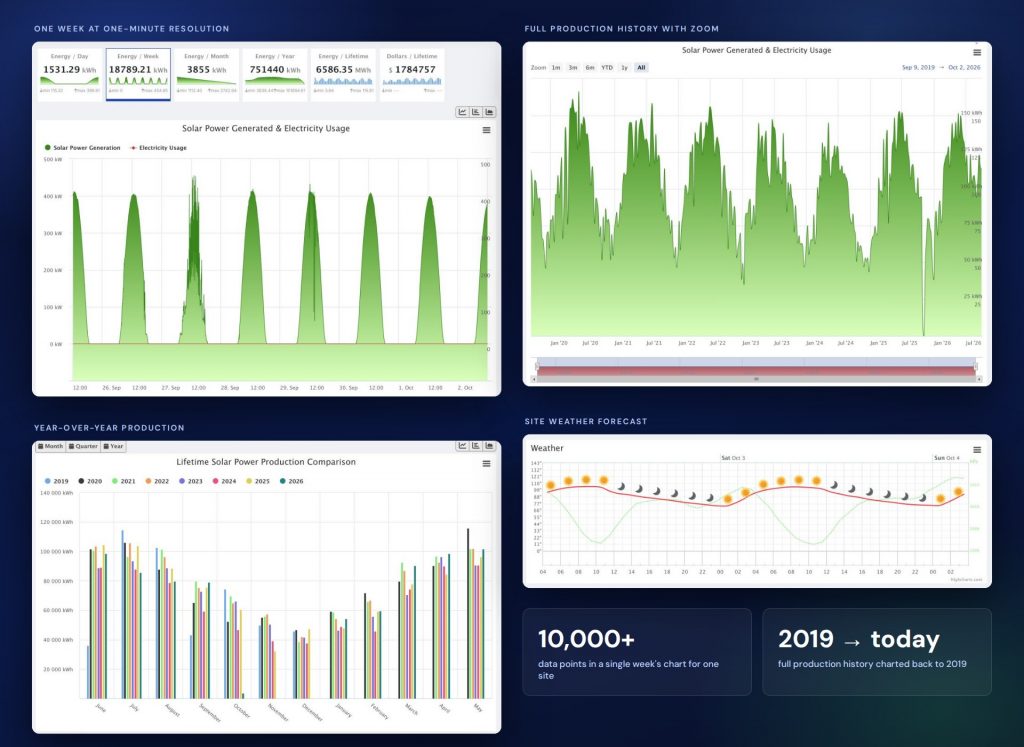
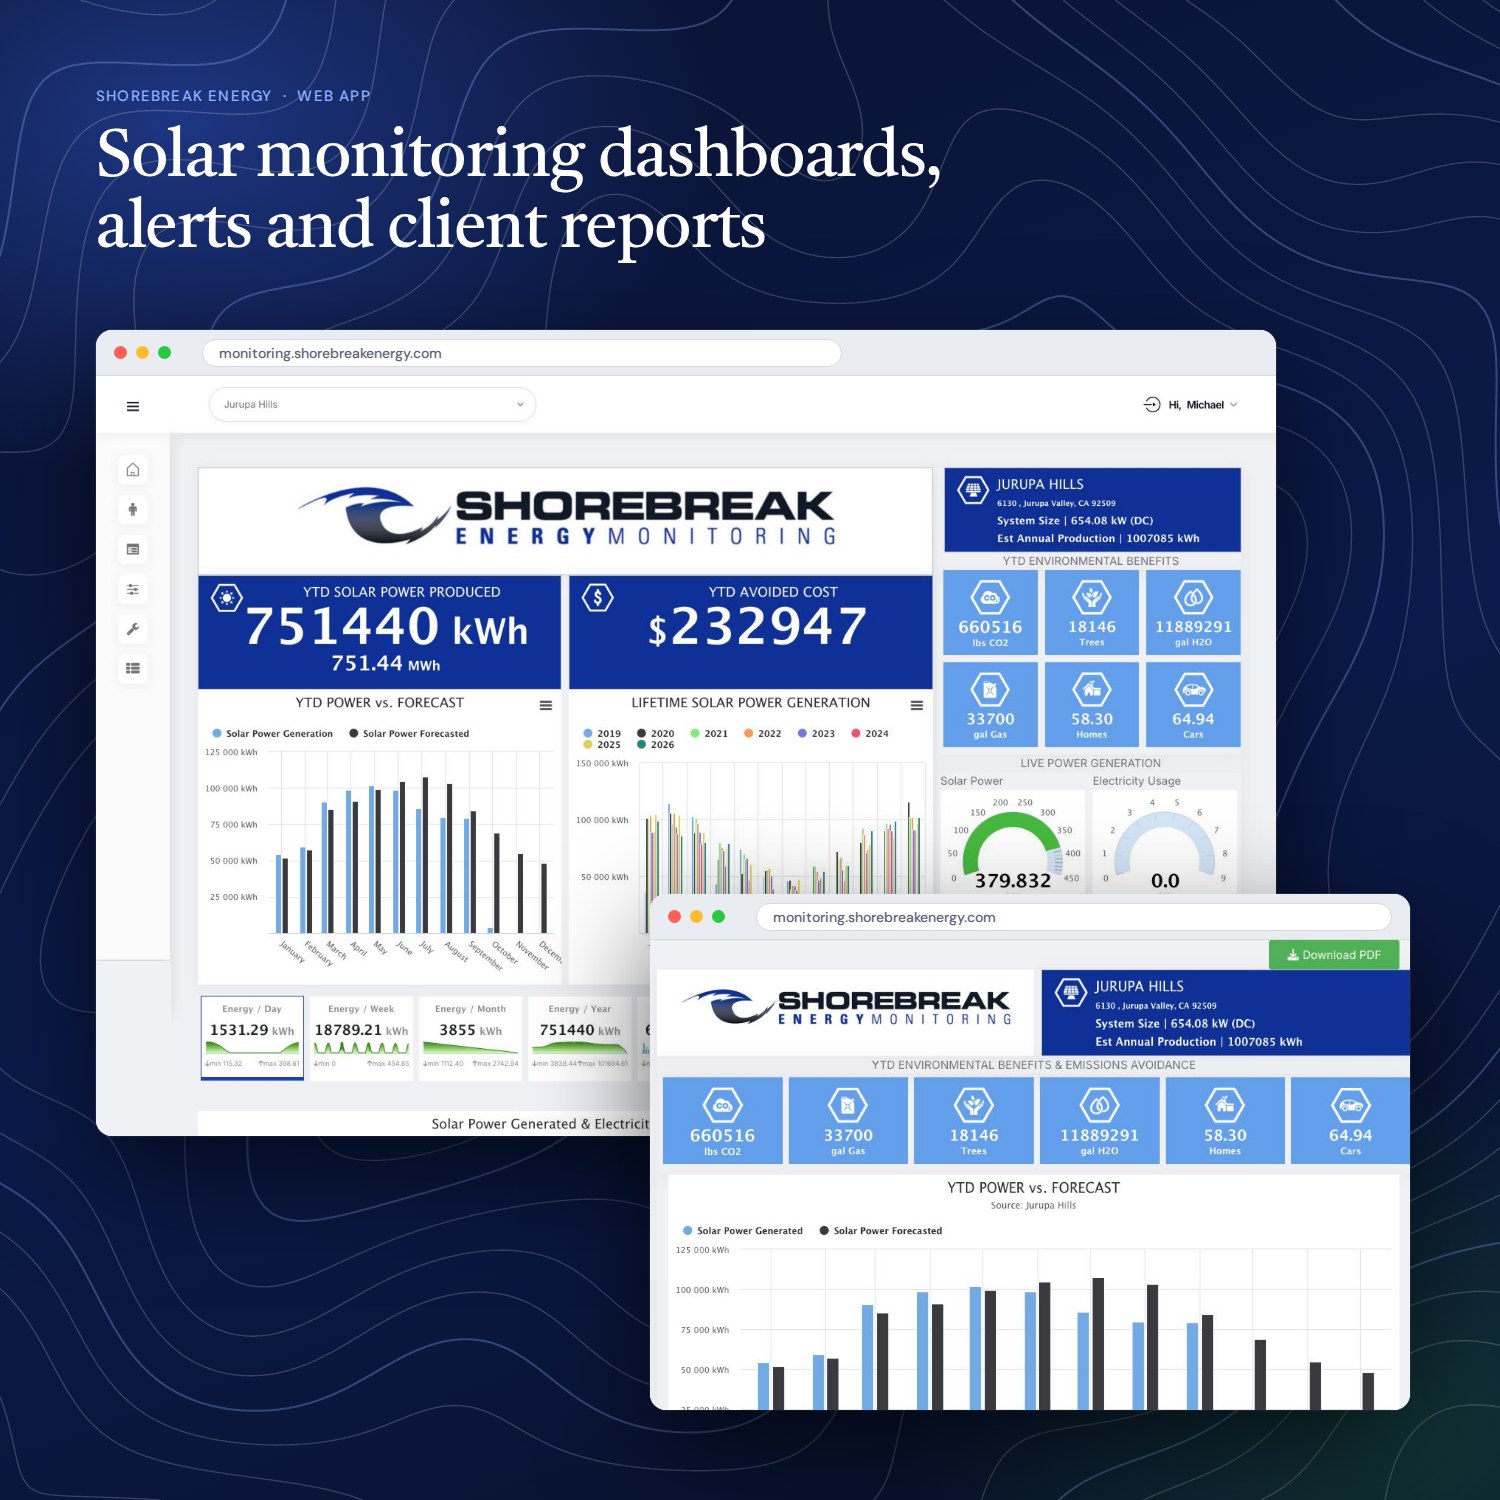
Each system has one page that answers the questions an owner asks: year-to-date production and avoided cost, production against forecast, a lifetime comparison, live gauges for power, amperage and voltage, and environmental equivalents. Every block is its own Elementor widget, and Highcharts handles the charting, from a week of one-minute data to a zoomable history back to 2019.
Portfolio view and alerting
For the operations team, a sites report lists every system with its monthly forecast, actual production and the percentage between them. Color coding makes an under-performing site stand out, the table exports to CSV, Excel and PDF, and a scheduled flatline check flags systems that stop producing.
Monthly client reports
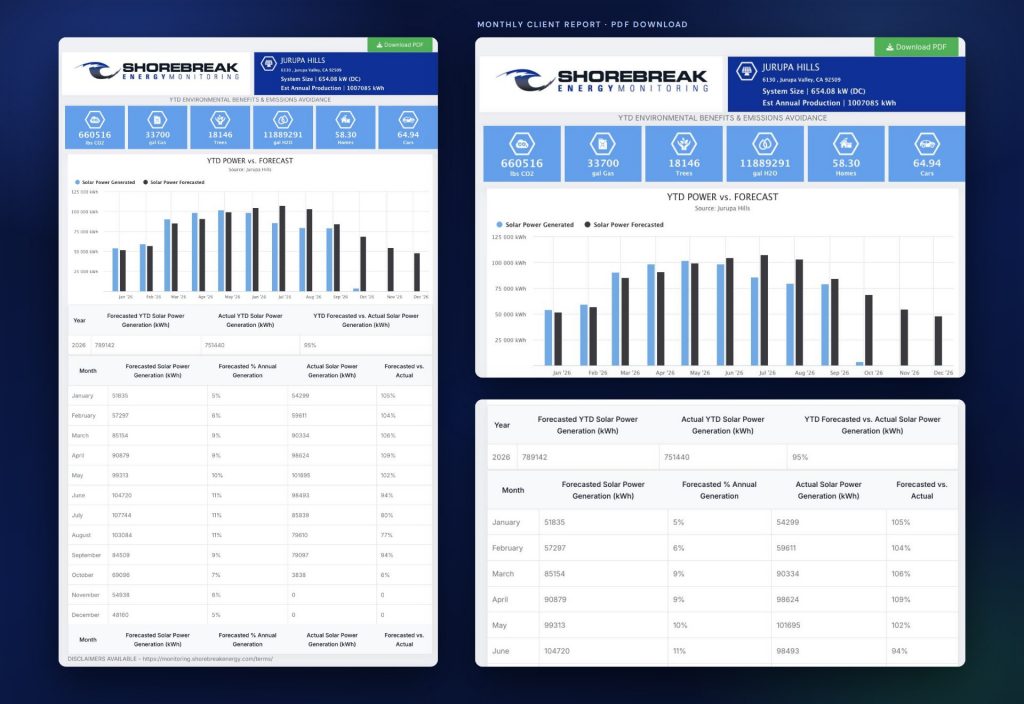
Every system gets a monthly report with year-to-date production against forecast, a month-by-month table and environmental equivalents. Owners can open it in the app or download it as a PDF.
Reliability
- Retries and logging record what arrived, what was retried and what failed on every run.
- Cloud SQL indexing, backup and restore workflows and planned schema changes.
- Raw telemetry archived in Cloud Storage with lifecycle and retention rules.
Where this shows up in Creartful AI
This is the kind of work our Expedition plan and Custom Applications cover: portals, internal tools and integrations built around how your business actually works, with the reporting to match.